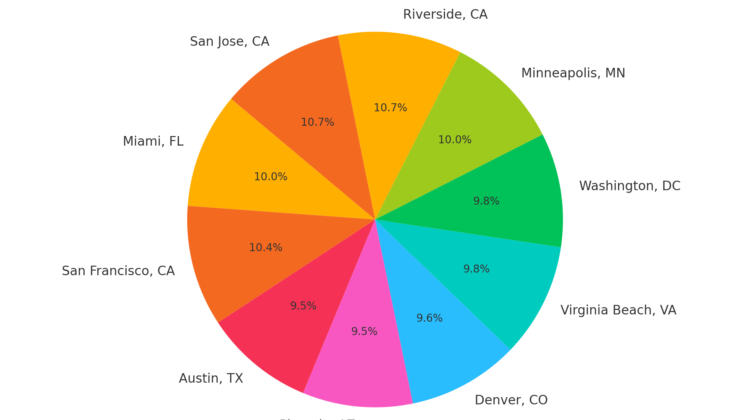
In September 2024, several major U.S. metropolitan areas showed significant increases in the percentage of home listings with price reductions, often accompanied by notable inventory growth:Source Realtor.com
- Miami, FL: 26.2% of listings had price reductions, up 3.5 percentage points from last year, with a 15% rise in inventory.
- San Francisco, CA: 27.4% of listings saw price cuts, up 1.2 points, alongside a 12% inventory increase.
- Austin, TX: 25% of listings experienced price reductions, up 8.8 points, with inventory surging by 20%.
- Phoenix, AZ: 25% of listings had price cuts, up 1.4 points, accompanied by a 10% increase in inventory.
- Denver, CO: 25.2% of listings saw reductions, up 1.6 points, with inventory growing by 18%.
- Virginia Beach, VA: 25.9% experienced price cuts, up 4.7 points, with a 14% rise in inventory.
- Washington, DC: 25.9% of listings had reductions, down slightly by 0.2 points, with inventory up by 9%.
- Minneapolis, MN: 26.4% saw price cuts, up 0.4 points, with a 13% increase in inventory.
- Riverside, CA: 28.1% had price reductions, up 0.6 points, with inventory up by 11%.
- San Jose, CA: 28.2% of listings saw price cuts, up 0.4 points, with a 10% inventory increase.
These trends reveal a cooling in key housing markets, with sellers adjusting prices and inventory levels to attract buyers, creating potential opportunities for real estate investors.
Note: While these insights provide a valuable big-picture view, real estate is hyper-local. To gain actionable insights, it’s essential to analyze neighborhood-level data where conditions and trends can vary significantly.

